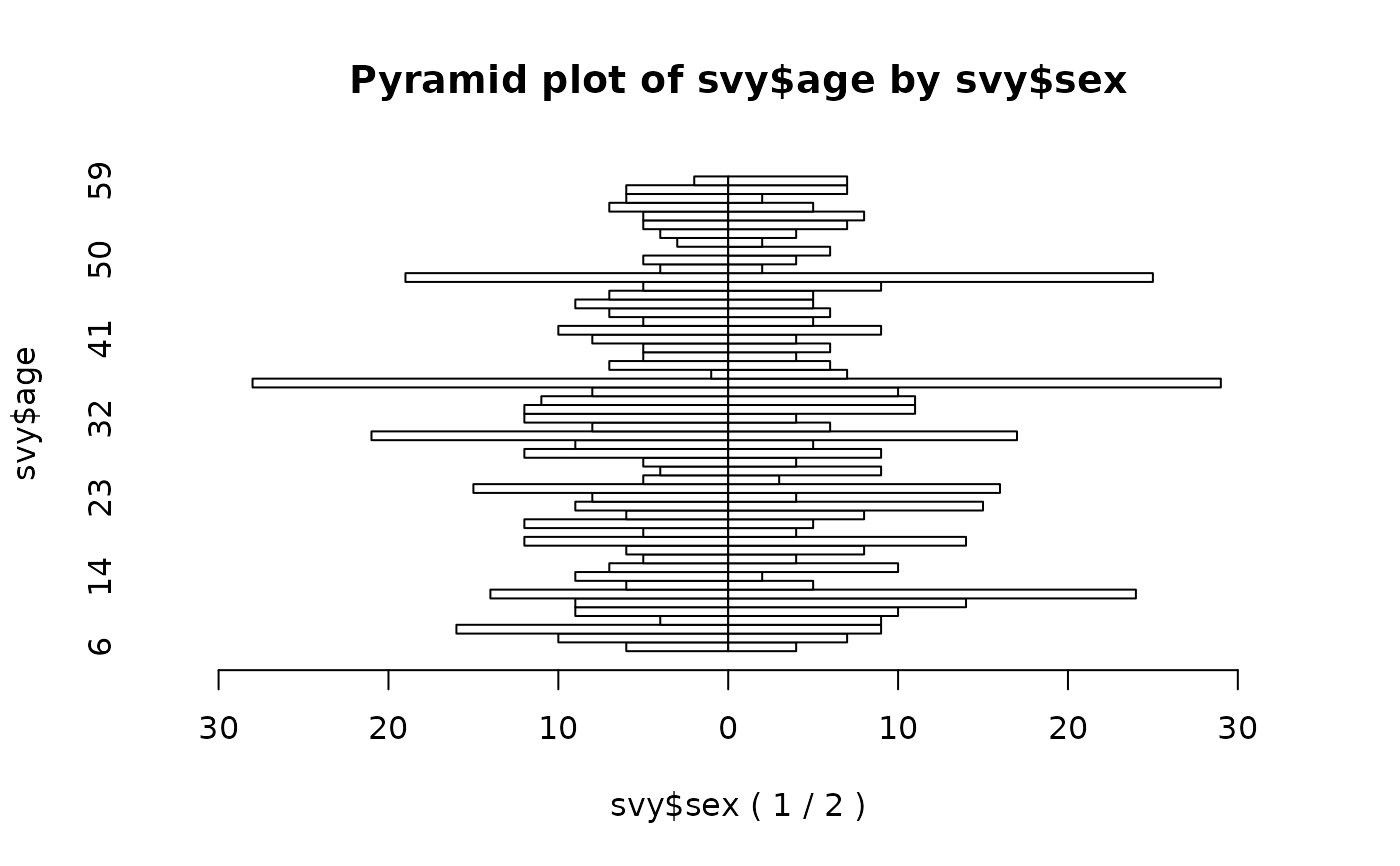
Pyramid plot function for creating population pyramids.
Usage
pyramid.plot(
  x,
  g,
  main = paste("Pyramid plot of", deparse(substitute(x)), "by", deparse(substitute(g))),
  xlab = paste(deparse(substitute(g)), "(", levels(as.factor(g))[1], "/",
    levels(as.factor(g))[2], ")"),
  ylab = deparse(substitute(x)),
  col = "white",
  ...
)
Arguments
- x
Vector of ages (usually grouped)
- g
Vector of groups (usually sex)
- main
Plot title
- xlab
x-axislabel- ylab
y-axislabel- col
Colours for bars. Either a single colour (default is
col = "white") for all bars, two colours (e.g.col = c("lightblue", "pink")) for left hand side bars and right hand side bars respectively, or many colours allocated on acheckerboardbasis to each bar- ...
Other graphical parameters