Plot helper function for ageChildren() function
Usage
# S3 method for class 'ageChildren'
plot(x, ...)
Arguments
- x
Object resulting from applying
ageChildren()function- ...
Additional
barplot()graphical parameters
Examples
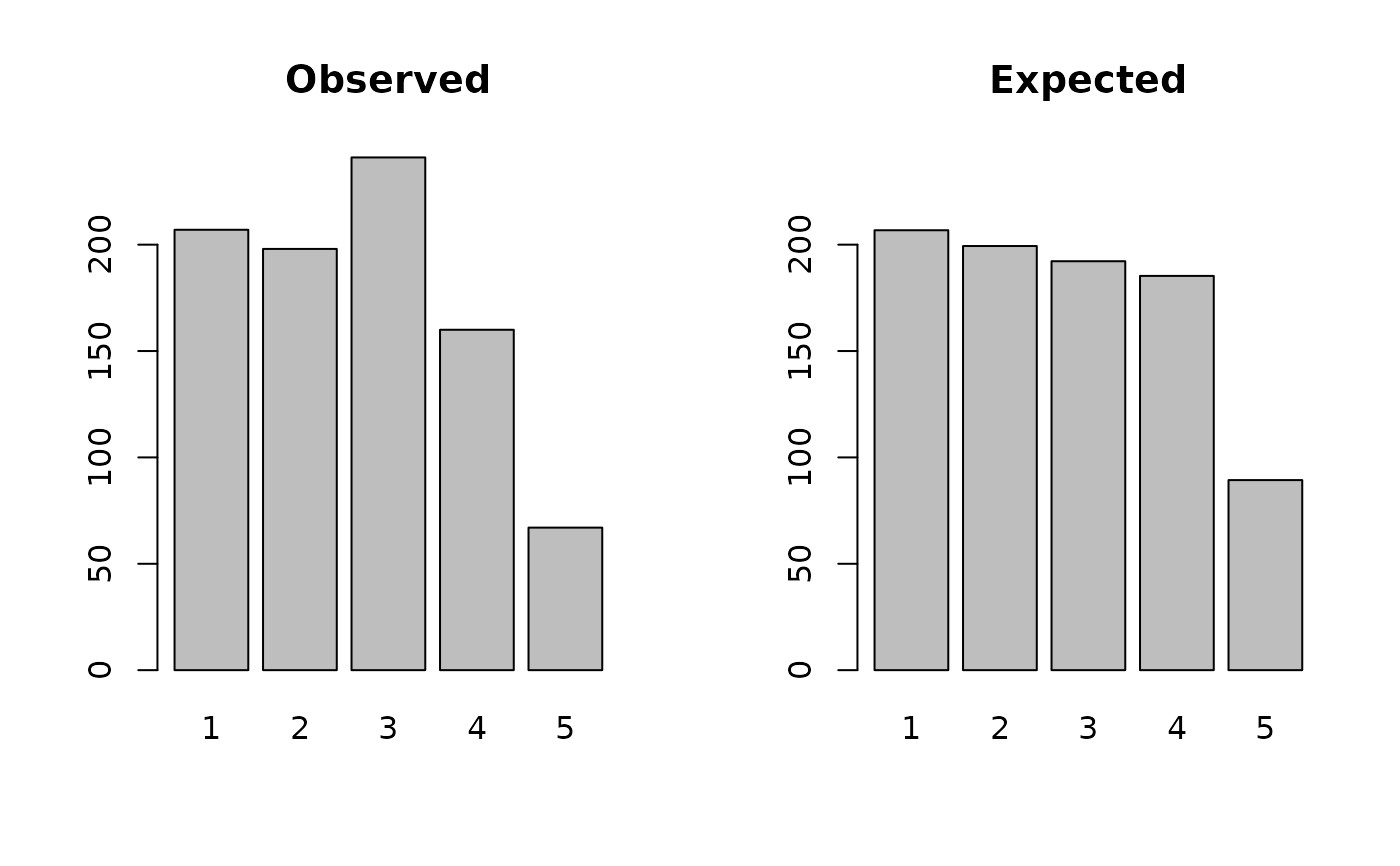
# Plot Chi-Squared test for age of children in dp.ex02 sample dataset using
# an u5mr of 1 / 10,000 / day.
svy <- dp.ex02
ac <- ageChildren(svy$age, u5mr = 1)
plot(ac)