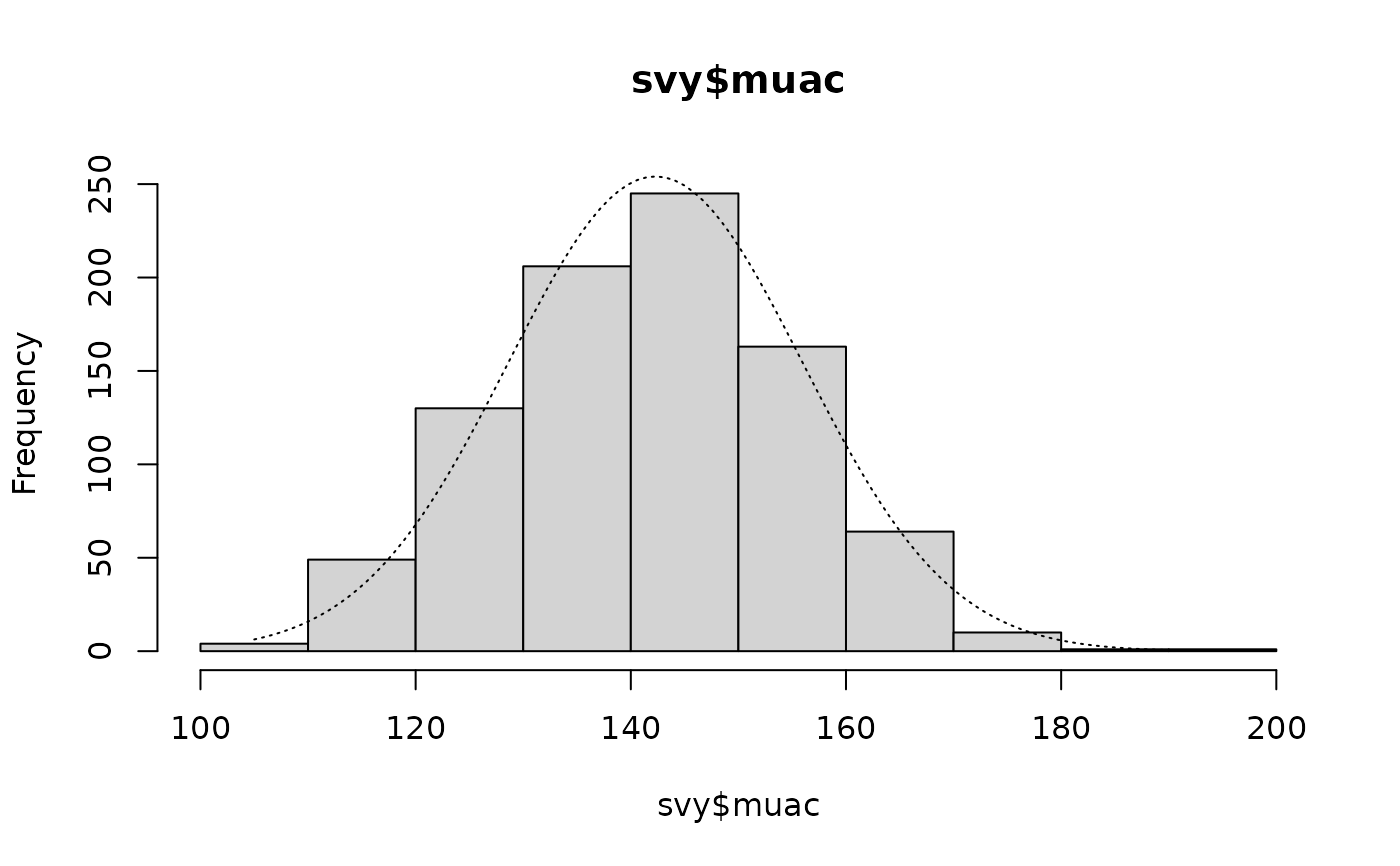
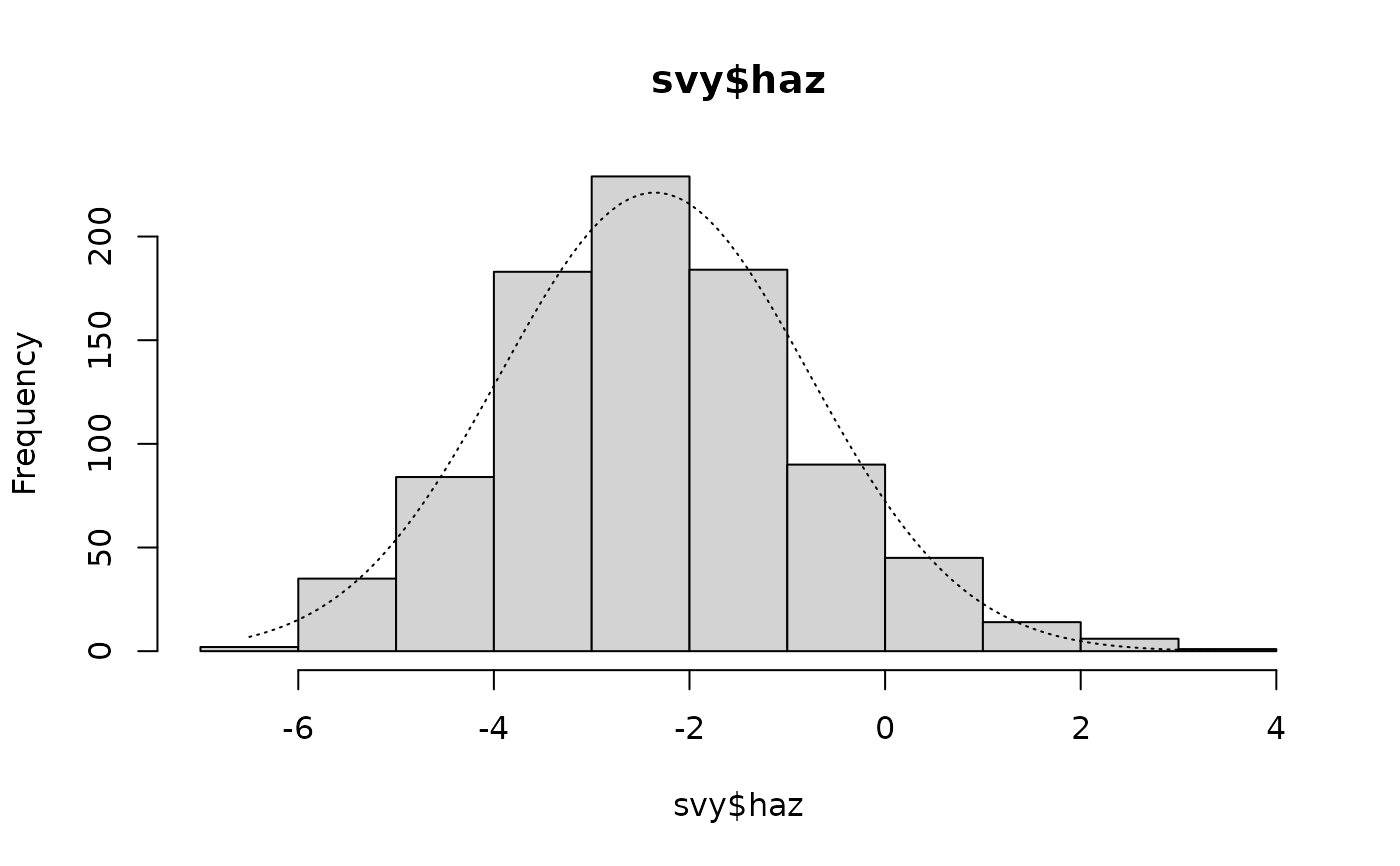
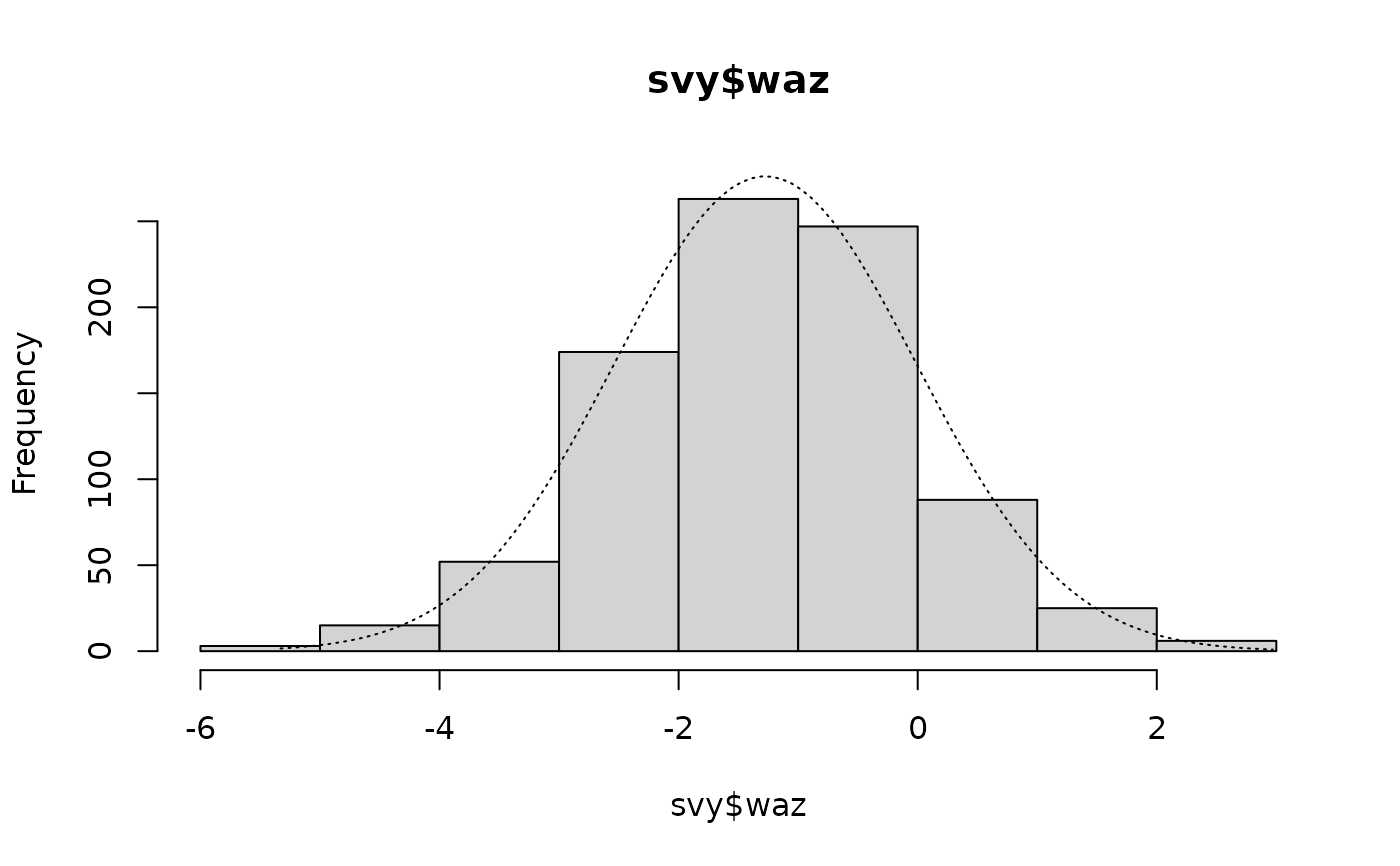
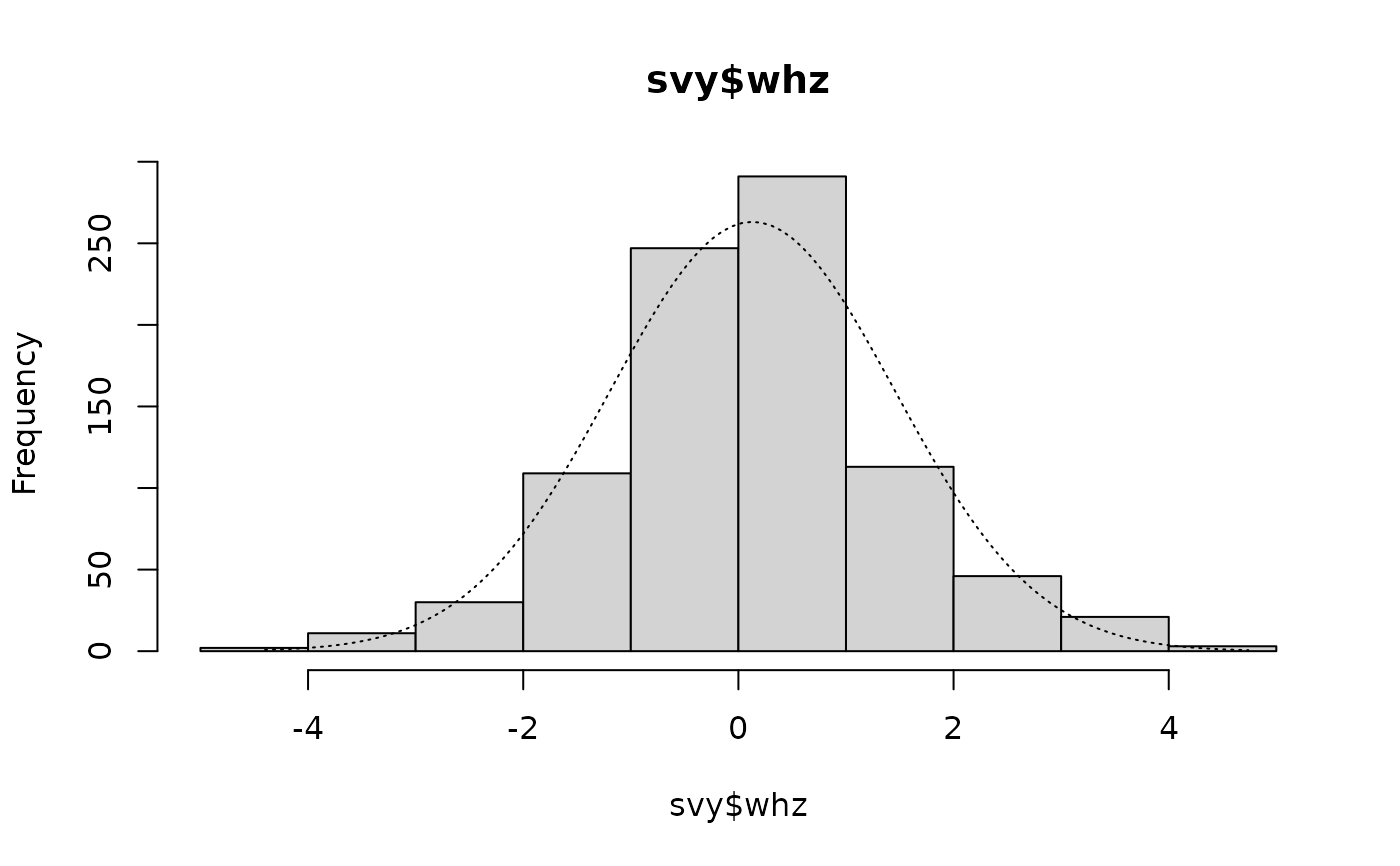
Histogram with normal curve superimposed to help with “by-eye” assessments of normality of distribution
Source:R/histNormal.R
histNormal.RdHistogram with normal curve superimposed to help with “by-eye” assessments of normality of distribution
Usage
histNormal(
  x,
  xlab = deparse(substitute(x)),
  ylab = "Frequency",
  main = deparse(substitute(x)),
  breaks = "Sturges",
  ylim = NULL
)